


Projects TabuVis
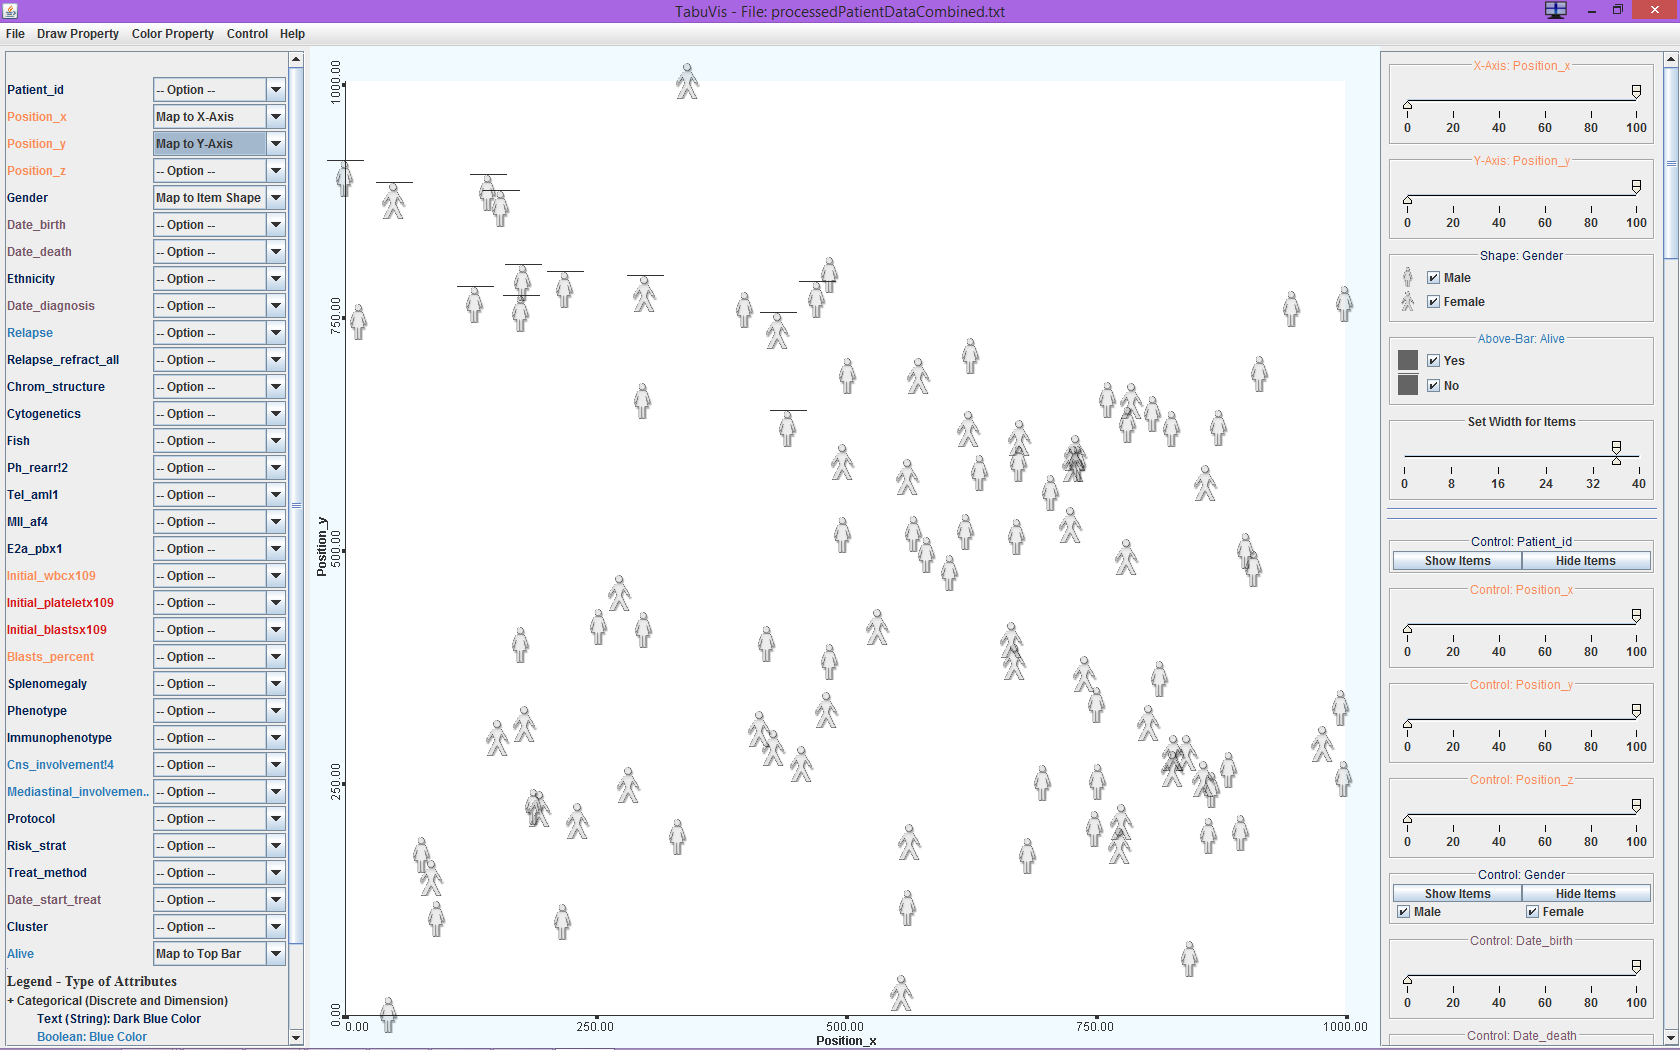
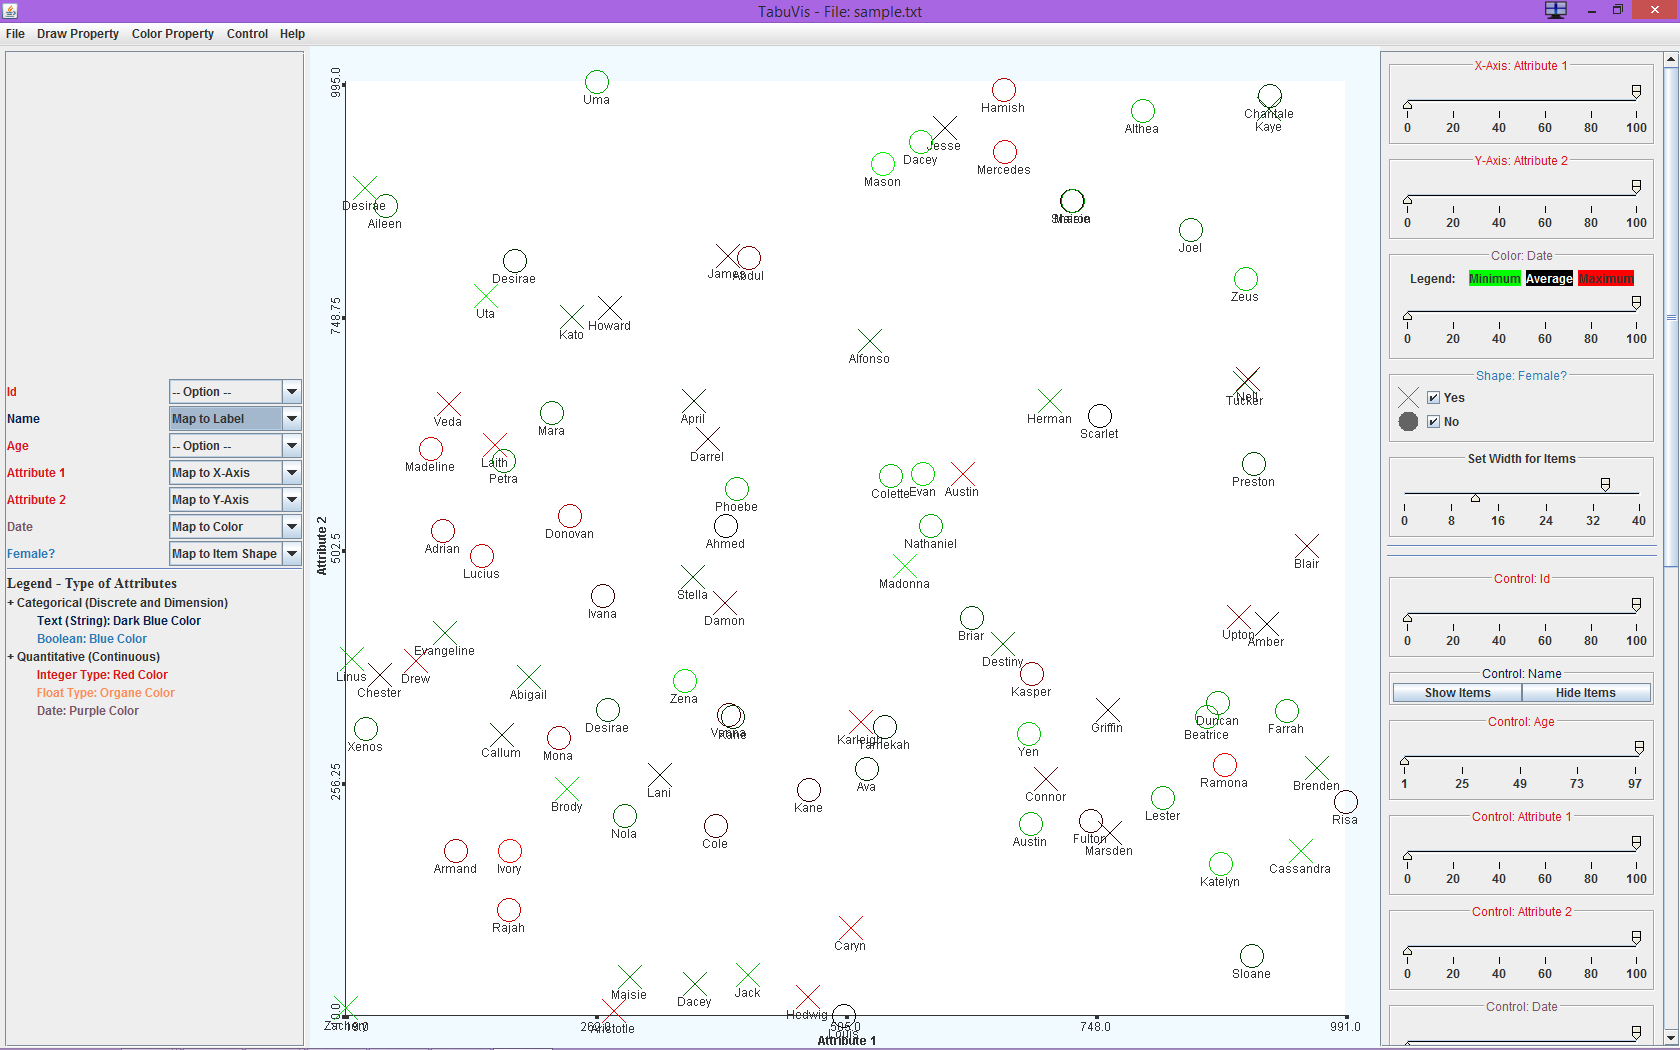
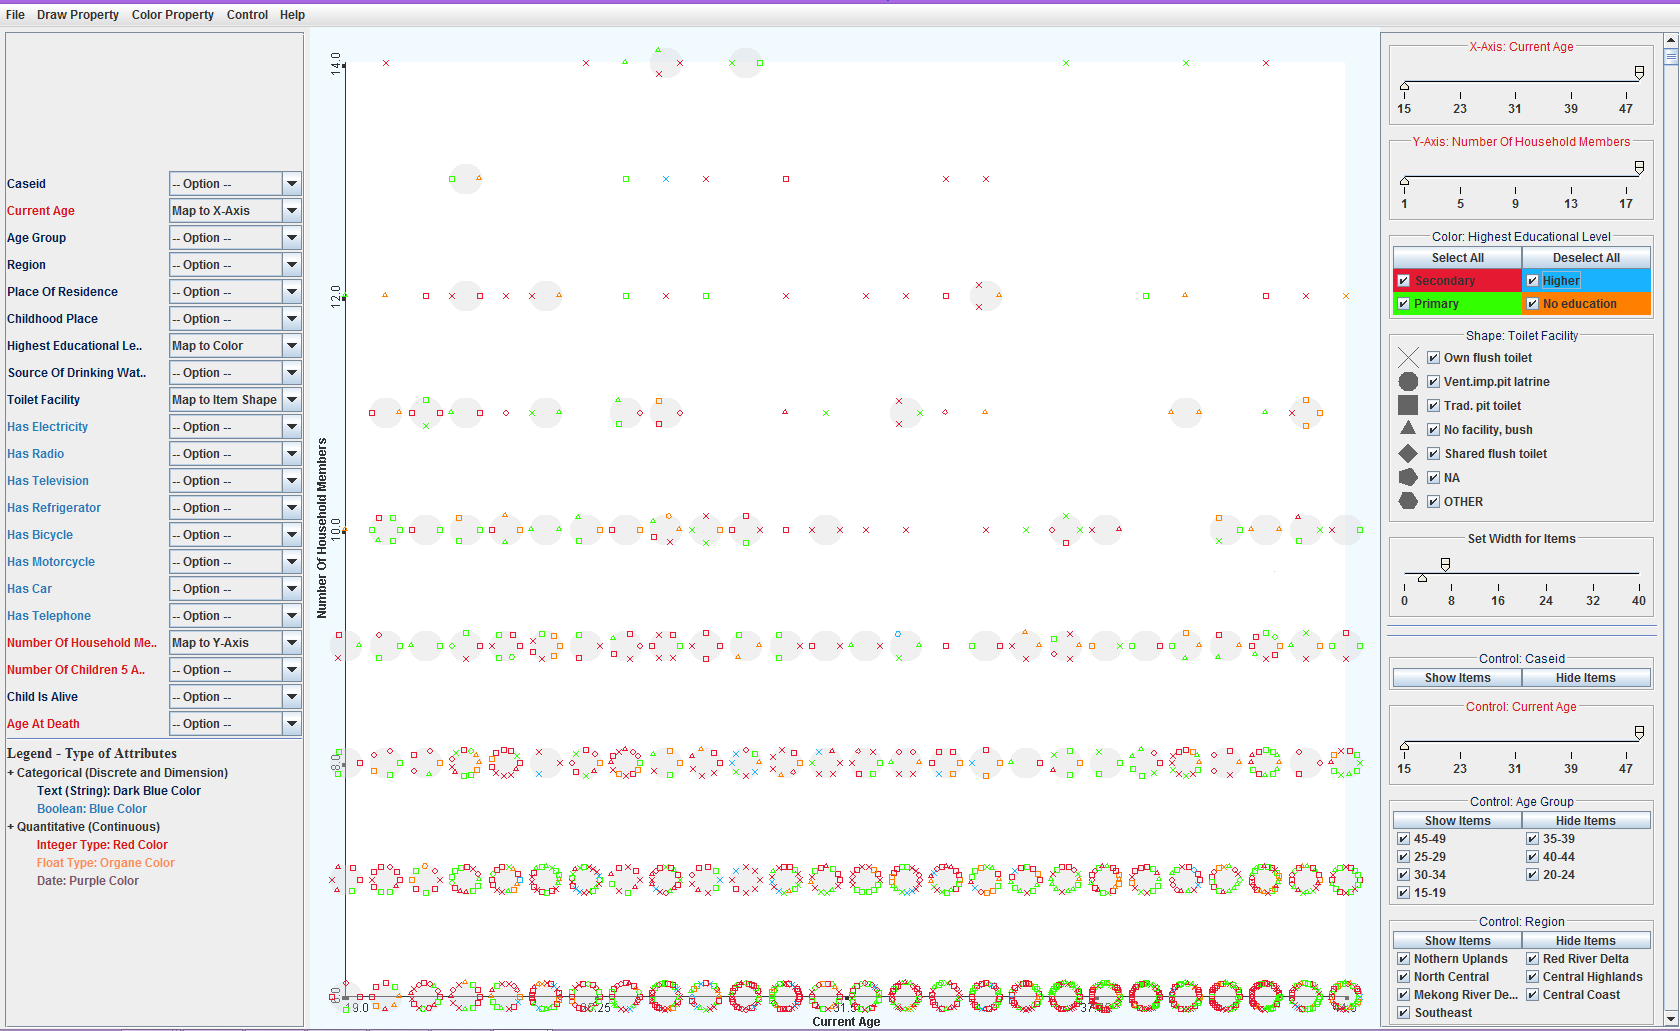
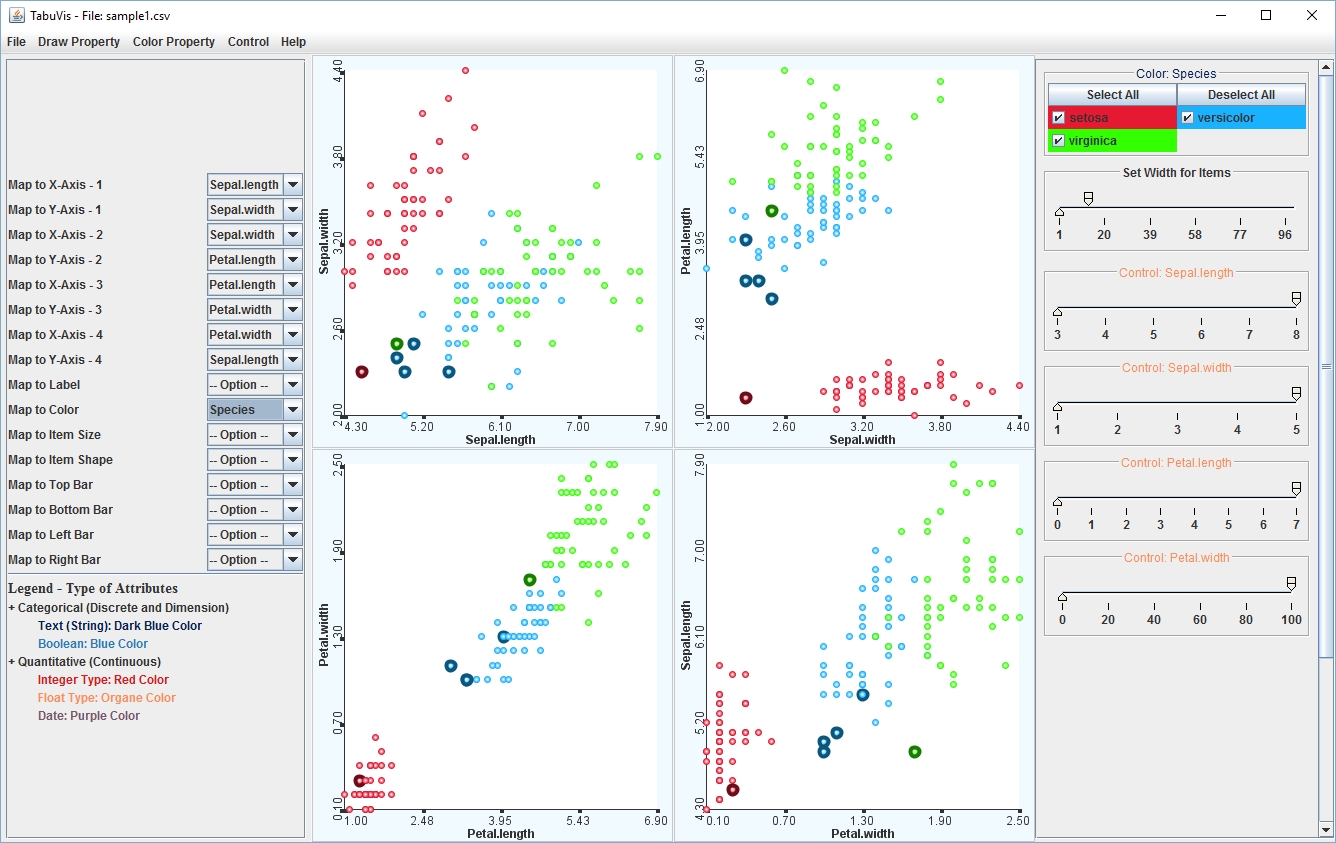
TabuVis is a comprehensive visual analysis tool that provides a flexible, customizable and interactive visualization for tabular (or multidimensional) data. It utilizes scatter-plot visualization approach to provide comprehensive and interactive views for different attribute mappings. The software includes many figures that enable the views of tabular data in many possible ways. It also include filtering, control, statistic, save, linking other tables, database extraction and many more.
Sorfware and source code are available for downloading at: SourceForce (https://sourceforge.net/projects/tabuvis/files/?source=navbar).
Copyright © 2011-2015 by Dr. Quang Vinh Nguyen, all rights reserved. Permission to use, copy, modify, and/or distribute this software for non-commercial use without fee is hereby granted, provided that the above copyright notice and this permission notice appear in all copies.
Publications
Nguyen Q. V., Simoff S., Qian Y., Huang M.L. 2016, "Deep Exploration of Multidimensional Data with Linkable Scatterplots". 9th International Symposium on Visual Information Communication and Interaction; Dallas, Texas: ACM; 2016. p. 43-50.
Nguyen, Q. V., Qian, Y., Huang, M. L. and Zhang, J., 2013, "TabuVis: A Tool for Visual Analytics Multidimensional Datasets", SCIENCE CHINA Information Sciences, 052105(12).
Nguyen, Q. V., Qian, Y., Huang, M.L., and Zhang, J., "TabuVis: A Light Weight Visual Analytics System for Multidimensional Data", in Proc. VINCI 2012 - International Symposium on Visual Information Communication and Interaction, September 2012, Hangzhou, China, ACM, pp. 61-64.
 |
 |
 |
 |
